Author

Health planning involves evaluating and assessing current and future health needs, goals, resources, and inadequacies.[1] The intent of health planning is to build health systems that ensure access to high-quality, cost-effective care for all populations. Certificate of need (CON) programs are a government tool for health planning that use regulation to allocate and distribute health care resources. CON programs are used, in part, to correct health care market deficiencies. To identify causal factors and alternative courses of action, planners must be able to spatially analyze multiple factors across a community.
A geographic information system (GIS) lets health planners visualize important factors. A GIS gathers, manages, and displays spatial data in layers that can be combined in 2D and 3D maps. GIS analysis and spatial modeling can increase planners’ ability to interpret data and reach reasonable conclusions.[2]
The global leader for GIS analysis tools is Esri, with over 45 percent market share worldwide.[3] Esri created ArcGIS software, the ArcGIS Online cloud platform, and is a geodata supplier. Esri is used globally by over 350,000 organizations, including 20,000 cities, 7,000 universities, and 50 percent of Fortune 500 companies. All 50 US state governments use Esri,[4] including Texas. Esri is also popular among major federal agencies, including the Centers for Disease Control and Prevention, which used it to map travel recommendations during the COVID-19 pandemic.[5]
Types of data
ArcGIS allows users to add demographic data in layers for areas and points.[6] Esri offers many data sets, including population, traffic, household information, income, daytime population, business data, and crime indexes.[7] ArcGIS also allows the analyst to add patient location indicators. Users can upload a patient’s street address from internal data, or ZIP code from state or federal data. Analysts can also add other external data sets.
Types of Maps
Drive Time Analysis
Esri tools can perform a variety of drive time analyses. Esri’s Network Analyst can create polygons around each location that show geographic areas closer to that location than others by distance or travel time.[8] The polygon boundaries represent areas of equal drive time between facilities, and areas within the polygon boundaries indicate the closest facility.[9]
RPC has used Esri to compare access to health care facilities by public transit or private car. The map below shows how RPC used ArcGIS to analyze travel time by public transit to possible clinic locations in Washington DC. RPC used transit time information from Google Maps to show transit time to specified locations in fifteen-minute increments.

Esri’s drive time analysis is an accepted method for determining accessibility of health services, and has been used in many articles in peer-reviewed journals, including the Social Science & Medicine Journal,[10] The Social Science Journal,[11] Drug and Alcohol Dependence,[12] Annals of the Association of American Geographers,[13] International Journal of Health Geographics,[14] and the Journal of the American College of Surgeons.[15]
Proximity Analysis
Analysts can use Esri to perform proximity analyses based on geographic distance and travel time. Proximity analysis can be performed three ways: buffer, near, and spatial query.
- Buffer analysis creates polygons around input features at a specified distance. Buffers can be created based on a drive time distance or geographic distance. An example of buffer analysis is to create a 30-minute drive time polygon around a hospital. The buffer would represent the area with a drive time to the hospital of 30 minutes or less.
- Near analysis can calculate the distance to the closest hospital from a specified address. It can also create connecting lines between features.
- Spatial query analysis can map data from another dataset.[16] An example of spatial querying is to locate all physician practices in a county.
Thiessen Polygons
Esri can map Thiessen polygons to show the area around each facility closest to that facility, compared to similar facilities based on straight-line distance.[17] Esri defines Thiessen polygons as:
- Where S is a set of points in coordinate or Euclidean space (x, y), for any point p in that space, there is one point of S closest to p, except where point p is equidistant to two or more points of S.
- A single proximal polygon (Voronoi cell) is defined by all points p closest to a single point in S, that is, the total area in which all points p are closer to a given point in S than any other point in S.[18]
Esri calculates the polygons by first inputting all points into a triangular irregular network (TIN). A TIN is a form of vector-based digital geographic data made of a set of vertices connected with edges to form a network of triangles.[19] Next, Esri generates the perpendicular bisectors of each triangle in the TIN network, which form the edges of the Thiessen polygons. The vertices of the polygons are determined based on the intersection of the bisectors.[20]
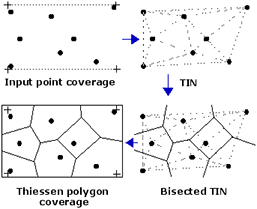
Figure 1. Esri Resources.[21]
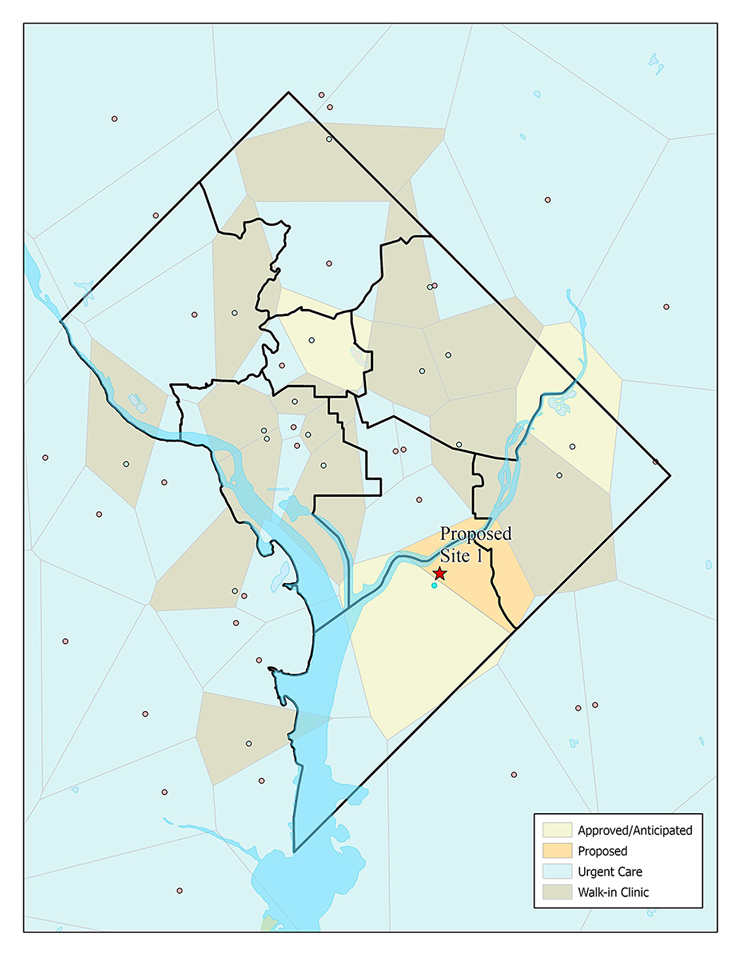
RPC used Thiessen polygons to help a client show how a proposed facility could improve geographic accessibility of services. The map below uses color-coded polygons to show the area geographically closest (by straight-line distance) to certain health facilities in Washington DC and surrounding areas. The polygons are color-coded by facility type. This way, each polygon shows the facility type as well as the area closest and more geographically accessible to the dot it surrounds than any other site.
Thiessen polygons are an accepted way to show the geographic area closest to a location. For example, a study published in the Library & Information Science Research by authors at Florida State University analyzed the accessibility of public libraries in Lake County, Florida.[22] The study used Thiessen polygons in ArcGIS to create service areas for each county library, and showed how distance affects the number of library users in each service area.
Thiessen polygons can likewise be used to analyze the geographic accessibility of health services. An analysis of the accessibility of speech therapists in rural Australia published in the International Journal of Speech-Language Pathology used ArcGIS and Thiessen polygons to define service areas for speech therapists.[23] Similarly, a study published by the Journal of Map & Geography Libraries used Thiessen polygons to analyze the accessibility of HIV Sentinel Clinics in Zambia. ArcGIS was used to show the closest clinic to each residence. This let health planners to define service areas and estimate the population in each clinic’s service area.[24]
ArcGIS allows health planners to visually assess a healthcare market. This is especially useful in CON applications, where applicants must demonstrate the need for a proposed health service or facility. RPC is experienced in using these GIS tools to help our clients accomplish their health facility development goals.
[1] https://www.apha.org/policies-and-advocacy/public-health-policy-statements/policy-database/2014/07/16/13/46/principles-of-comprehensive-health-planning-for-personal-health-services#:~:text=The%20comprehensive%20health%20planning%20process,of%20action%3B%20(2)%20establish
[2] “The ArcGIS Book,” Esri, https://learn.arcgis.com/en/arcgis-book/.
[3] “ARC Advisory Group Report Names Esri GIS Market Leader,” AP News, January 31, 2019, https://apnews.com/press-release/pr-businesswire/45f4cf3301534f3e8bec5b13d199547b.
[4] Esri, “Fact Sheet.”
[5] “COVID-19 Travel Recommendations by Destination,” Centers for Disease Control and Prevention, updated October 26, 2020, https://www.cdc.gov/coronavirus/2019-ncov/travelers/map-and-travel-notices.html.
[6] “Enrich (Analysis),” Esri, ArcGIS Pro, https://pro.arcgis.com/en/pro-app/tool-reference/analysis/enrich.htm.
[7] “U.S. Data Overview,” ArcGIS, Esri Demographics, https://doc.arcgis.com/en/esri-demographics/data/us-intro.htm.
[8] “Service Area Analysis Layer Properties,” Esri, ArcGIS Pro, https://pro.arcgis.com/en/pro-app/help/analysis/networks/service-area-analysis-layer.htm#ESRI_SECTION1_D36A18B15D704F0DBA9B4C766A4A2719.
[9] “Visualize the Reachable Area with Service Area,” Esri, ArcGIS Pro, https://pro.arcgis.com/en/pro-app/help/analysis/networks/service-area-tutorial.htm.
[10] A UK postcode is assigned to each specific street address. It is not the equivalent of a US ZIP code.
[11] Tom Carlson, Sally York, Janet Primomo, “The Utilization of Geographic Information Systems to Create a Site Selection Strategy to Disseminate an Older Adult Fall Prevention Program,” The Social Science Journal 48, no. 1 (Dec. 2011): 159–174, https://doi.org/10.1016/j.soscij.2010.09.002.
[12] Paul J. Joudrey et al., “Pharmacy-Based Methadone Dispensing and Drive time to Methadone Treatment in Five States within the United States: A Cross-sectional Study,” Drug and Alcohol Dependence 211 (Mar. 2020): 107968, https://doi.org/10.1016/j.drugalcdep.2020.107968.
[13] Xun Shi et al., “Spatial Access and Local Demand for Major Cancer Care Facilities in the United States,” Annals of the Association of American Geographers 102, no. 5 (Mar. 2012): 1125–1134, https://doi.org/10.1080/00045608.2012.657498.
[14] Paul L. Delamater et al., “Measuring Geographic Access to Health Care: Raster and Network-based Methods,” International Journal of Health Geographics 11, no. 15 (May 2012), https://doi.org/10.1186/1476-072X-11-15.
[15] Stas S. Amato et al., “Geographic Coverage and Verification of Trauma Centers in a Rural State: Highlighting the Utility of Location Allocation for Trauma System Planning,” Journal of the American College of Surgeons (Oct. 3, 2020), https://doi.org/10.1016/j.jamcollsurg.2020.08.765.
[16] Esri Training, Introduction to Proximity Analysis.
[17] Thiessen polygons are also known as Voronoi polygons. https://www.esri.com/training/catalog/5f170c5c9a0e6512bd2bf913/introduction-to-proximity-analysis/
[18] “Create Thiessen Polygons (Analysis),” Esri, https://pro.arcgis.com/en/pro-app/tool-reference/analysis/create-thiessen-polygons.htm.
[19] “What is a TIN surface?” ArcGIS Desktop, https://desktop.arcgis.com/en/arcmap/latest/manage-data/tin/fundamentals-of-tin-surfaces.htm.
[20] “Create Thiessen Polygons,” Esri,
[21] http://resources.esri.com/help/9.3/arcgisengine/java/gp_toolref/coverage_toolbox/thiessen2.gif.
[22] Sung Jae Park, “Measuring Public Library Accessibility: A Case Study Using GIS,” Library & Information Science Research 34, no. 1 (Jan. 2012): 13–21, https://doi.org/10.1016/j.lisr.2011.07.007.
[23] Sarah Verdon, Linda Wilson, Michelle Smith-Tamaray, and Lindy McAllister, “An Investigation of Equity of Rural Speech-Language Pathology Services for Children: A Geographic Perspective,” International Journal of Speech-Language Pathology 13, no. 3 (June 2011): 239–250, https://doi.org/10.3109/17549507.2011.573865.
[24] Imelda K. Moise, Ezekiel Kalipeni, and Leo C. Zulu, “Analyzing Geographical Access to HIV Sentinel Clinics in Relation to Other Health Clinics in Zambia,” Journal of Map & Geography Libraries: Advances in Geospatial Information, Collections & Archives 7, no. 3 (Sept. 2011): 254–281, https://doi.org/10.1080/15420353.2011.599756.