Authors


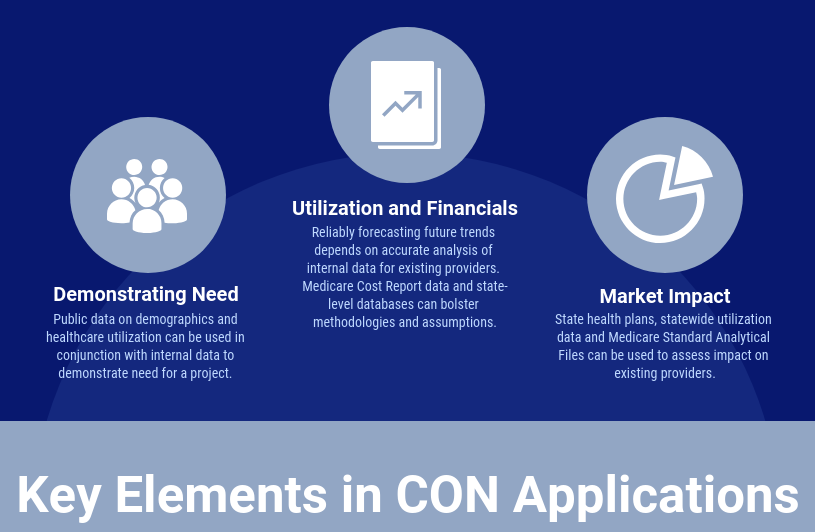
Since 1981, RPC has prepared Certificate of Need (CON) applications in over 30 states. Requirements vary by state, but most applications must address three main topics: (1) need, (2) financial feasibility, and (3) impact on existing providers. This blog will discuss the data sources RPC finds useful when preparing a CON application. The links are active and should take you to the relevant sources. If you or your client is considering a project that requires a CON, we would be happy to help.
- Showing Need for a Project
Data on existing healthcare providers and patient populations in the service area are the starting points for need arguments in CON applications. Data should guide project owners on whether to apply for a CON, or to pursue an alternative strategy to enter a market. Understanding each data source, and how to use them together leads to better business decisions and a creditable need analysis if a CON application is the route chosen.
Demographic Data
Population growth increases the demand for healthcare services. Some states mandate the use of state agency population projections for counties. Even in these states, other sources of population data can be used at the zip code or census tract level. Data for smaller geographic areas can show a need within a county that is not visible at the county level.
There are several national suppliers of small-area demographic data. ESRI sells demographic data for ZIP Codes and U.S. Census block-level groups. Available data elements include age group, sex, race, ethnicity, income level and employment status. Spotlight also sells detailed demographic data for small-area demographic analysis. Spotlight also sells information on the healthcare providers and businesses in an area. Information on major employers and area industries can substantiate higher population growth rates than those in the state agency projections. The United States Census Bureau makes demographic and economic estimates and projections available at no cost.
The Center for Medicare and Medicaid Services (“CMS”) publishes demographic data (age group, sex, race) for Medicare beneficiaries at the county level in its Master Beneficiary Summary File. The Medicare demographic data can be combined with Medicare utilization data to estimate and project use rates for this population. This is valuable when applying for healthcare services for which Medicare beneficiaries are the largest patient population. Examples are hospice, skilled nursing facilities, and inpatient rehabilitation.
Both national and state-level resources can provide further insights on populations with special needs. For data on the local veteran population, the U.S. Department of Veteran Affairs publishes veteran population tables at the county-level. For health literacy rates at a county level, the U.S. Department of Education created the Program for International Assessment of Adult Competencies (PIAAC), a survey measuring key cognitive and workplace skills in adults. Many states have invested in data sites which can shows statistics about the state and its counties. Florida’s Bureaus of Community Health Assessment and Vital Statistics power the Community Health Assessment Resources Tool Set (CHARTS). CHARTS is a free, publicly-available tool that provides easy access to community and statewide health indicator data. Users can query a wide range of indicators, including chronic diseases, environmental health, life expectancy, death rates and more. Non-profit corporations can also be a valuable resource for assessing special needs in a community. The Community Partnership for the Prevention of Homelessness collects data on homelessness in the District of Columbia. They publish point-in-time counts, compile data tables and publish story maps available for public consumption. These are a few examples but there are endless resources available.
State-Level Utilization Data
Public data on utilization of health services are available from three sources: state health plans, license renewal applications, and state and federal claims databases. Most CON states with numeric need methodologies for healthcare services publish annual health statistics. They publish the numeric need determination and the data and calculations underlying the determination. Data for several years can show trends over time. CON agency staff often base their analysis of an application on data from the state health plan. Other states publish need for a health service annually (or more often) but do not have annual health statistics.
Some states, including Alabama, North Carolina, South Carolina, and Tennessee, require hospitals and other health facilities to file annual licensure reports (called Joint Annual Reports or Annual Hospital Surveys in some states). The level of detail in these reports varies from state to state, but most show facility level data on patient volume and service line utilization. Some states use the American Hospital Association annual survey questionnaire as a data collection instrument. Data from these reports are publicly available and can be used in a CON application to analyze the market for various services.
Public claims databases are available in some states, but in other states the claims database is controlled by the state hospital association and is only available to its members. The records in the data bases have some or all the data elements found on a standard claims form (i.e., CMS1450 or CMS1500). North Carolina requires hospitals to report claims data to a third-party organization. The data are only available to hospitals that report into the database, and not to the public. Other states, like Florida, make deidentified claims data for hospitals, emergency departments, ambulatory surgery centers and rehabilitation providers available to the public. These data show utilization, and allow analysis of utilization of facilities and services by diagnosis and procedure, and by patient demographics. Claims data can show trends at the state, local and facility levels. These data also show charges for each facility, which can be used to analyze the financial feasibility of the project and the financial impact on existing providers,
According to the All-Payer Claims Database Council, 23 states have an existing All-Payer Claims Database (APCD), and two states are currently implementing an APCD.[1] APCDs collect health care claims data on facilities and practitioners from payors and combine them into a public database. Each state with an APCD has its own policy on release of its claims data. An interactive map of APCD legislation by state, and participation in APCD’s is available at https://www.apcdcouncil.org/state/map.
Medicare Standard Analytical Files
Standard Analytical Files (SAFs) are published by CMS. They contain all fee-for-service Medicare claims for services rendered during a calendar year. SAF data sets are available for inpatient and outpatient facilities, hospice and home health services, durable medical equipment, and skilled nursing facilities. There is no SAF for ambulatory surgery centers. Data are organized at the claim level. Because SAFs contain a unique patient identifier for each Medicare beneficiary, an analyst can follow patients across many types of care. The data can show when a geographic market lacks a key service line or portion of the continuum of care. Depending on the provider type, data elements available in the files include:
- Unique beneficiary identifier
- Patient demographic information (county of residence, age group, sex, and race)
- Place of service and attending physician identification
- Diagnosis codes
- Procedure codes
- Charges
- Medicare allowed amount
- Patient discharge status
To obtain SAFs, a person must have a Data Use Agreement with CMS and agree to CMS restrictions on use and disclosure of the data. New data are published quarterly and annually.
The percentage of Medicare beneficiaries enrolled in Medicare Advantage plans is approaching 50 percent.[2] Because SAFs include only traditional, fee-for-service Medicare claims, it is important to know the percentage of Medicare beneficiaries enrolled in Medicare Advantage plans in the service area. To calculate use rates for the Medicare population, one must use the correct number of enrollees in traditional Medicare in the denominator. RPC is not aware of a CMS public file with claims data for enrollees in Medicare Advantage plans.
Medicare Physician and Other Supplier File
The Physician and Other Supplier file shows data on procedures delivered to traditional Medicare patients by physicians and other non-facility providers. The data include the National Provider Identifier (NPI) of the physician, the average charges, counts of beneficiaries and utilization, and Medicare payment for each CPT code. The data in this file are aggregated at the code and provider level instead of the individual claim records in the SAF. It is used to determine charges at a code level for a variety of physician-provided services, such as anesthesia, imaging, and surgical procedures. The files are available on a calendar year basis from 2012 to 2018.
The comparable SAF is the Carrier 5% Sample File. This file takes a 5% sample of Medicare beneficiaries who received care during a calendar year and includes all physician and therapist claims for that beneficiary for the year. There are more data elements and less data suppression in this file than in the Physician and Other Supplier file. The best file to use depends on the question being addressed. CMS has research-identifiable data files, but distribution of these files is highly restricted.[3]
Internal Data
When the CON applicant is an existing facility or provider, the applicant’s internal data is extremely useful to determine the need for a project. Providers hold detailed information not available from public sources. Here are examples of internal data and how they can be used:
- Claims Data: Allows for detailed analysis of needs by patient demographic and payor groups. Trends in length of stay, patient acuity and diagnosis provide insight into how patients’ evolving needs can best be met. Procedure and diagnosis data elements allow for focused analysis of specific service lines, while physician indicators can show how key providers drive growth.
- Operating Room Logs: Allow for an analysis by time-of-day to identify capacity constraints and bottlenecks for surgical procedures.
- Recruitment Plans: Along with claims-level data, this can show how a provider is meeting the growing demand for service, and how planned physician recruitment will increase the demand for key services.
- Financial Feasibility
Demonstrating a project’s financial feasibility is a core requirement for most CON applications. Most applications must address short-term and long-term financial feasibility. An applicant proves short-term feasibility by showing the project cost and showing it has the capital to develop and initiate the proposed project. Most states require applicants to prove “long-term financial feasibility” with utilization and financial projections for the first two or three years of operations. The state agency will determine if the applicant’s projections reasonably show the project’s revenues will exceed its expenses within a prescribed period. In a competitive review or an administrative hearing, other applicants and existing providers may challenge volume projections and financial assumptions. Even if not required on a CON application form, an applicant should make a cash flow projection to determine the project’s maximum negative cash flow once operational. This is the amount of capital – debt and equity – the applicant should show it can make available. Having a conservative, well-documented basis for both is crucial to an application’s success. Below, we discuss several data sources useful in determining the financial feasibility of a project.
Internal Financial Data
For existing providers, internal data are extremely useful in demonstrating the financial feasibility of a project. Internal data are more detailed than data available from public sources. These are examples of internal data sources and how they can be used.
- Claims data from provider billing software allows detailed analysis of charges and payments by procedure and diagnosis codes, payor and performing physician. The detailed data can be the basis for projecting future charges and payments for the planned services. Analysis by procedure and diagnosis data elements shows how service line growth will affect profitability. The internal claims data should show actual collections to support net revenue projections.
- Audited financial statements, including a balance sheet, statement of income and expenses with supporting schedules, statement of changes in financial position, notes to the statement and auditor’s letter are often required in CON applications. They show the applicant’s or parent company’s financial health and ability to fund the proposed project.
Applicants usually must have a letter showing availability of funds to the project from a lender or from the applicant’s treasurer or CFO. If the project involves construction, a letter from the architect verifying the estimated cost is often required.
Public Data Sources
A competing applicant or an existing provider opposing a CON application will find several publicly data sources helpful to challenge utilization and financial projections.
Federal Data
Medicare Standard Analytical Files (SAFs), as previously described above, contain all fee-for-service Medicare claims for services rendered during a calendar year.
Medicare Cost Reports (“MCRs”) are submitted annually by hospitals, nursing homes, hospices, and home health agencies. They contain data on facility characteristics, utilization, staffing, operating costs, charges, and revenue. CMS publishes a subset of the cost report data in the Healthcare Provider Cost Reporting Information System (HCRIS) for public use. Cost report data are useful to compare revenue and expenses among facilities.
IRS Form 990s has data on executive compensation of private tax-exempt providers, such as hospitals, hospices, and nursing homes. These forms also have financial information on any community benefits. They may be issues in competitive reviews. They may also be issues when an existing provider objects that a new provider will hurt its ability to provide charity care or other community benefits.
State Data
Besides showing need, public claims data can be important in showing long-term financial feasibility. So can claims data restricted to hospitals if the applicant has access. The claims data shows the payor mix for specific services for the service area. It will also be the basis for the service volume projections that drive the project pro forma.
Annual surveys and license renewal applications contain data useful for determining (or refuting) financial feasibility. Many CON states require healthcare institutions to submit annual reports detailing utilization. Some of these contain financial data. Tennessee is an example of a state that includes some financial data. The Joint Annual Reports (JARs) have data on an institution’s payor mix, charges, and expenses. These data can be especially helpful when a provider is looking to enter a new market and wants to see the payor mix to expect. North Carolina is an example of a state with financial information limited only to payor mix data in their License Renewal Applications. Other states, such as Alabama, do not require financial data in annual reports. However, their reports have utilization data for each provider that provide a basis for utilization projections. These projections provide the basis for financial projections to demonstrate or challenge financial feasibility.
- Impact of the Project on Existing Providers
A legislative goal of most CON programs is controlling health care costs by avoiding unnecessary duplication of services. Because of this, many states require applicants to show that a proposed project will not materially negatively affect existing providers. Most states allow existing providers to appeal the approval of a new provider and argue the new entrant would adversely impact their operations and finances. Therefore, applicants must show there will be sufficient demand that their project will not greatly reduce the volume at existing providers below their volumes in the baseline year. A number or public and private data sources can help an applicant show this. Below we will explain those sources and show example of their use.
Public Data Sources
Federal Data
Medicare Standard Analytical Files (SAFs), as previously described above, provides a valuable tool for assessing market shares of existing providers. SAF data can allow a market entrant, or the opponents, to determine how the proposed project will affect patient volume and Medicare revenue.
For an existing provider proposing to enter a new market, SAF data can show whether the provider has hurt existing providers in another market it entered. SAF data can quantify utilization (admissions, patient days, procedures, etc.) before and after a provider enters a market. This will show if existing providers in a market saw volumes decline.
Medicare Cost Reports (“MCRs”), as previously described above, provide useful information for assessing potential financial impact on existing providers. MCR data show a provider’s financial health over time using metrics such as net patient income, operating margin, and additional income sources, like foundation contributions and grants. MCRs also have data on volume and payor mix. They can be the basis for arguments about a provider’s financial vulnerability to new market entrants.
IRS Form 990s, as previously described above, have data on executive compensation of private tax-exempt providers, such as hospitals, hospices, and nursing homes. This information can be very useful if a nonprofit entity claims financial harm or vulnerability but gives large compensation package to its executives. Form 990s can also provide detail on financial support healthcare providers receive from related foundations.
State Data
Data available varies significantly from state to state. However, as previously described above, many CON states publish need publications or state health plans. Utilization data in these documents can be used to compare volume trends for a particular provider, service, or geographic market. These data also allow potential CON applicants to compare geographic areas to identify those where existing providers did not serve as many patients as expected for a market of similar size. Such information may allow an applicant to argue that its entrance into a market will increase utilization of services to a better level for residents.
CON decisions and findings, often published online, provide useful, detail on any approved but not yet operational providers. In many states, approved providers are counted against the inventory of needed services. Even for states or services where there is no numeric need determination, an approved provider may argue the state should not approve another provider before giving it time to ramp up services.
Previous CON Applications often include detailed information on an established provider’s historical and projected utilization, payor mix, gross and net patient revenues. A provider may assert its financial health a CON application to prove its financial feasibility. When preparing a CON application, an applicant should review applications recently filed by existing providers to gain insight into service line planning, physician recruiting, and charity care policies. Representation in past applications may prevent an existing provider from making an adverse impact argument.
RPC Data Resources
RPC has experience using all the data sources discussed in this post when assisting our client on CON matters. We have Data Use Agreements for all CMS Standard Analytical Files. We have used many state data files. We have the IT resources and staff expertise to analyze large internal data bases from physician practices, hospitals, and other facilities. By combining data expertise with health planning expertise and experience, we can effectively address the impact on existing providers in the CON process.
We hope you found this discussion of data sources used for a project useful. If you have questions about any of the data sources, please contact Darcy Schaeffer at 512-371-8011 or dschaeffer@rpcconsulting.com.
[1] Interactive State Report Map | APCD Council
[2] 2024 Medicare Statistics and Fast Facts | MedicareAdvantage.com
[3] See: https://www.cms.gov/research-statistics-data-and-systems/files-for-order/identifiabledatafiles
Learn More About RPC’s CON Services Here