Author

Author: Darcy Schaeffer, MLS
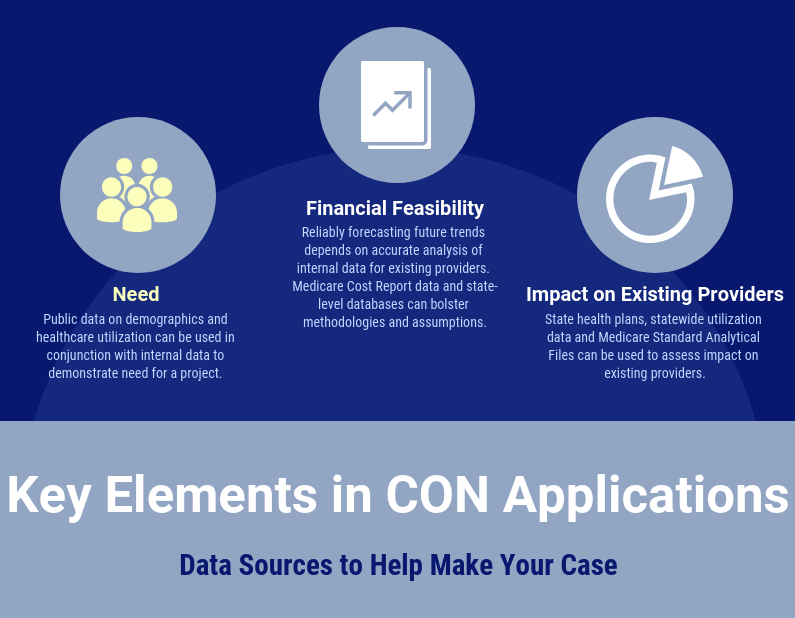
Certificate of Need (CON) requirements vary by state, but most applications must address three main topics: need, financial feasibility and impact on existing providers. This blog post is the first in a three-part series on these topics. This part discusses data sources to prove or disprove the need for a CON project.
Data on healthcare providers and patient populations are the starting points for need arguments in CON applications. Data should guide decision makers on whether to apply for a CON, or to pursue an alternative growth strategy. Understanding each data source, and how to use them together leads to creditable need analysis and informed decisions.
Demographic Data
Population growth increases the demand for healthcare services. Some states mandate the use of state population projections in a CON need formula. These are usually county-level projections. Even in these states, other data sources can be used for population analysis at the zip code or census tract level. Having the data for smaller geographic areas allows better definition of the service area for a facility or service.
ESRI sells demographic data for ZIP Codes and U.S. Census block-level groups. Available data elements include age group, sex, race, ethnicity, income level and employment status. Other companies, such as Spotlight, also sells detailed demographic data for small-area demographic analysis. Spotlight also sells information on the number and types of healthcare providers and businesses in an area. Information on major employers and area industries can help substantiate above average population growth rates.
The Center for Medicare and Medicaid Services (“CMS”) publishes demographic data (age group, sex, race) for Medicare beneficiaries at the county level in its Master Beneficiary Summary File. The Medicare demographic data can be combined with Medicare utilization data to estimate and project use rates for this population. This is particularly valuable when applying for healthcare services for which Medicare beneficiaries are the largest patient population. Examples are hospice, skilled nursing and inpatient rehabilitation.
State-Level Utilization Data
Publicly available data on utilization are available from three sources: state health plans, licensure applications and large utilization or claims databases. Most CON states with numeric need methodologies for healthcare services publish annual state health plans. These contain both the need determination and the basic calculations used to arrive at the determination. The data for these calculations are often shown in the state health plan. They can provide useful information on trends over time, when compiled properly. These data are often used by CON agency staff, and are a useful first resource for demonstrating need through utilization trends and analysis of existing providers.
Some states, including Alabama, North Carolina, South Carolina and Tennessee require hospitals and some other facilities to file annual licensure reports (called Joint Annual Reports in some states). The level of detail in these reports varies from state to state, but most show facility level data on patient volume and service line utilization. Data from these reports are publicly available and can be used in a CON application to analyze the market for various services.
Large claims databases are available in some states, but their public availability varies considerably. Some states, like North Carolina, require hospitals to report claims-level utilization data to a third-party organization that compiles the data. The data is not available to the general public, but is available to hospitals that report into the database. Other states, like Florida, provide publicly available discharge data for hospitals, emergency departments, and rehabilitation providers. These data show utilization, and allow analysis of utilization of facilities and services by diagnosis and procedure, and by patient demographics. Claims data can show trends at the state, local and facility levels . These data also show charges for each facility, which can be used to show financial feasibility and to show financial impact on existing providers,
According to the National Association of Health Data Organizations (NAHDO), seventeen states have implemented or developed an All Payer Claims Database (APCD). APCDs collect health care claims data on facilities and practitioners from payors and combine them into a large-scale database. Each state with an APCD has its own policy on release of its claims data. An interactive map of APCD legislation by state, and participation in APCD’s is available at https://www.apcdcouncil.org/state/map.
Medicare Standard Analytical Files
Standard Analytical Files (SAFs) are published by CMS. They contain all fee-for-service Medicare claims for services rendered during a calendar year. SAF data sets are available for facilities, durable medical equipment, and professional services. Data are organized at the claim level. Because SAFs contain a unique patient identifier for each Medicare beneficiary, these data enable an analyst to follow patients across many types of care. The data can show when a geographic market lacks a key service line or portion of the continuum of care. Depending on the provider type, data elements available in the files include:
- Unique beneficiary identifier
- Patient demographic information (county of residence, age group, sex, and race)
- Place of service and attending physician identification
- Diagnosis codes
- Procedure codes
- Charges
- Medicare allowed amount
- Patient discharge status
To obtain SAFs, a person must have a Data Use Agreement with CMS and agree to CMS restrictions on use and disclosure of the data. New data are published quarterly and annually.
Medicare Physician and Other Supplier File
The Physician and Other Supplier file shows data on procedures delivered to Medicare patients by physicians and other non-facility providers. The data include the National Provider Identifier (NPI) of the physician, the average charges, counts of beneficiaries and utilization, and Medicare payment for each CPT code. The data in this file are aggregated at the code and provider level instead of the individual claim records in the SAF. It is used to determine charges at a code level for a variety of physician-provided services, such as anesthesia, imaging, and surgical procedures. The files are available on a calendar year basis from 2012 to 2018.
The comparable SAF is the Carrier 5% Sample File. This file takes a 5% sample of Medicare beneficiaries who received care during a calendar year and includes all physician and therapist claims for that beneficiary for the year. There are more data elements and less data suppression in this file than in the Physician and Other Supplier file. The best file to use depends on the question being addressed.
Internal Data
When working with existing providers, internal data is extremely useful to determine the need for a project. Providers hold detailed information not available from public sources. Here are some examples of internal data and how they can be used:
- Claims Data: Allows for detailed analysis of needs by patient demographic and payor groups. Trends in length of stay, patient acuity and diagnosis provide insight into how patients’ evolving needs can best be met. Procedure and diagnosis data elements allow for focused analysis of specific service lines, while physician indicators can show how key providers drive growth.
- Operating Room Logs: Allow for an analysis by time-of-day to identify capacity constraints and bottlenecks for surgical procedures.
- Recruitment Plans: Along with claims-level data, this can show how a provider is meeting the growing demand for service, and how planned physician recruitment will increase the demand for key services.
We hope you found this discussion of data sources used to show need for a project useful. If you have questions about any of the data sources, please contact Darcy Schaeffer at 5123718011 or dschaeffer@rpcconsulting.com. The next blog post in this series will discuss data sources to show a project’s financial feasibility in a CON application.